
Performance dashboards
The FP&M SETA Performance Dashboard and the functional dashboards.
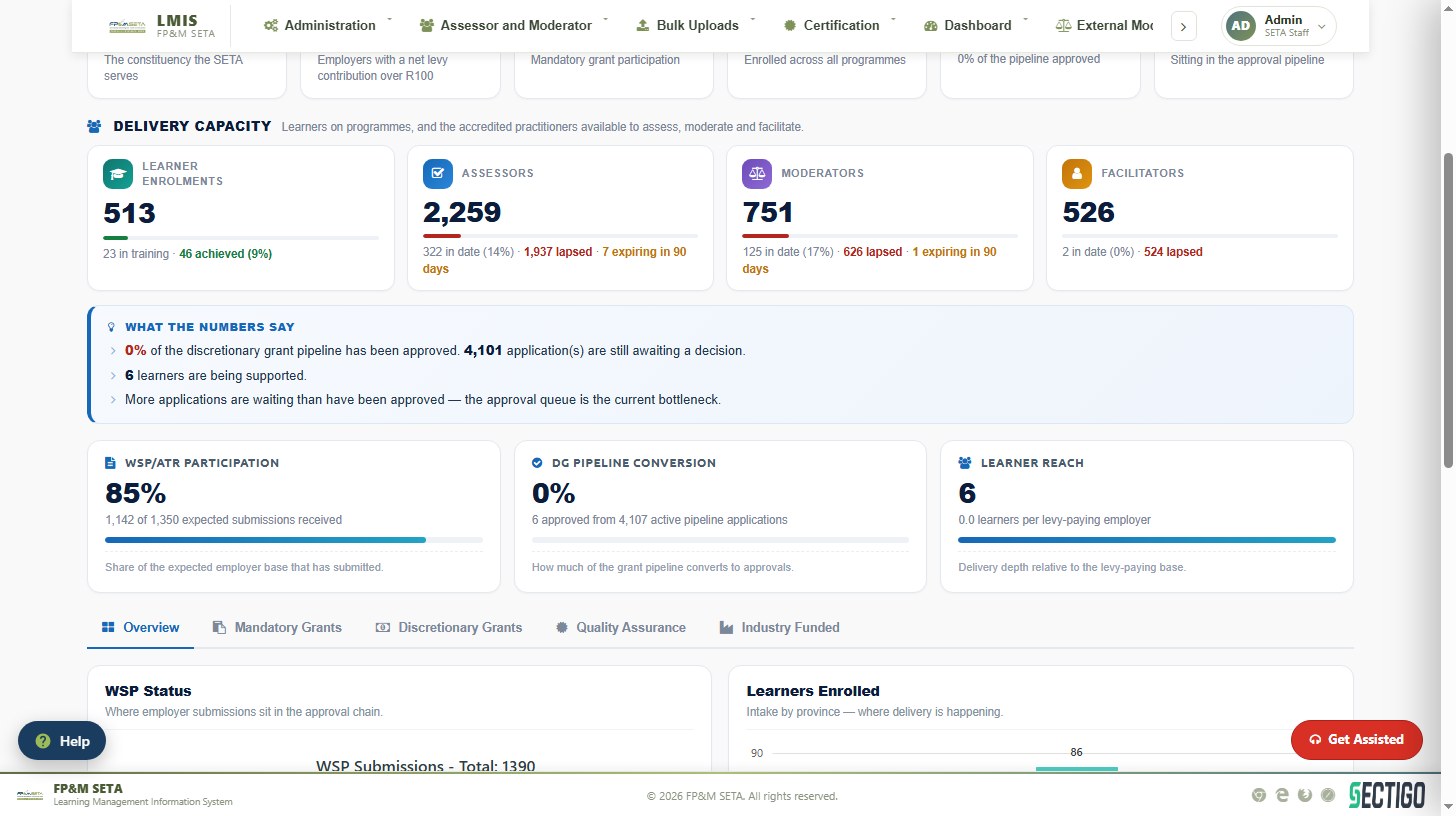
The Performance Dashboard is the landing page for SETA staff. It gives levy compliance, skills delivery and grant funding at a glance for the selected financial year.
- Use the Financial Year, Quarter, Start Date and End Date filters to set the period; Reset returns to the current year.
- Read the KPI cards: Levy-paying Employers, Employers Paying over R100, WSP/ATR Submissions, Learners Supported, DG Approved and DG Awaiting Decision.
- The Delivery Capacity row shows Learner Enrolments, Assessors, Moderators and Facilitators with in-date, lapsed and expiring counts. Click a tile to see the records behind the figure.
- What the numbers say summarises the position in plain language.
- Use the Overview, Mandatory Grants, Discretionary Grants, Quality Assurance and Industry Funded tabs for charts on each area.
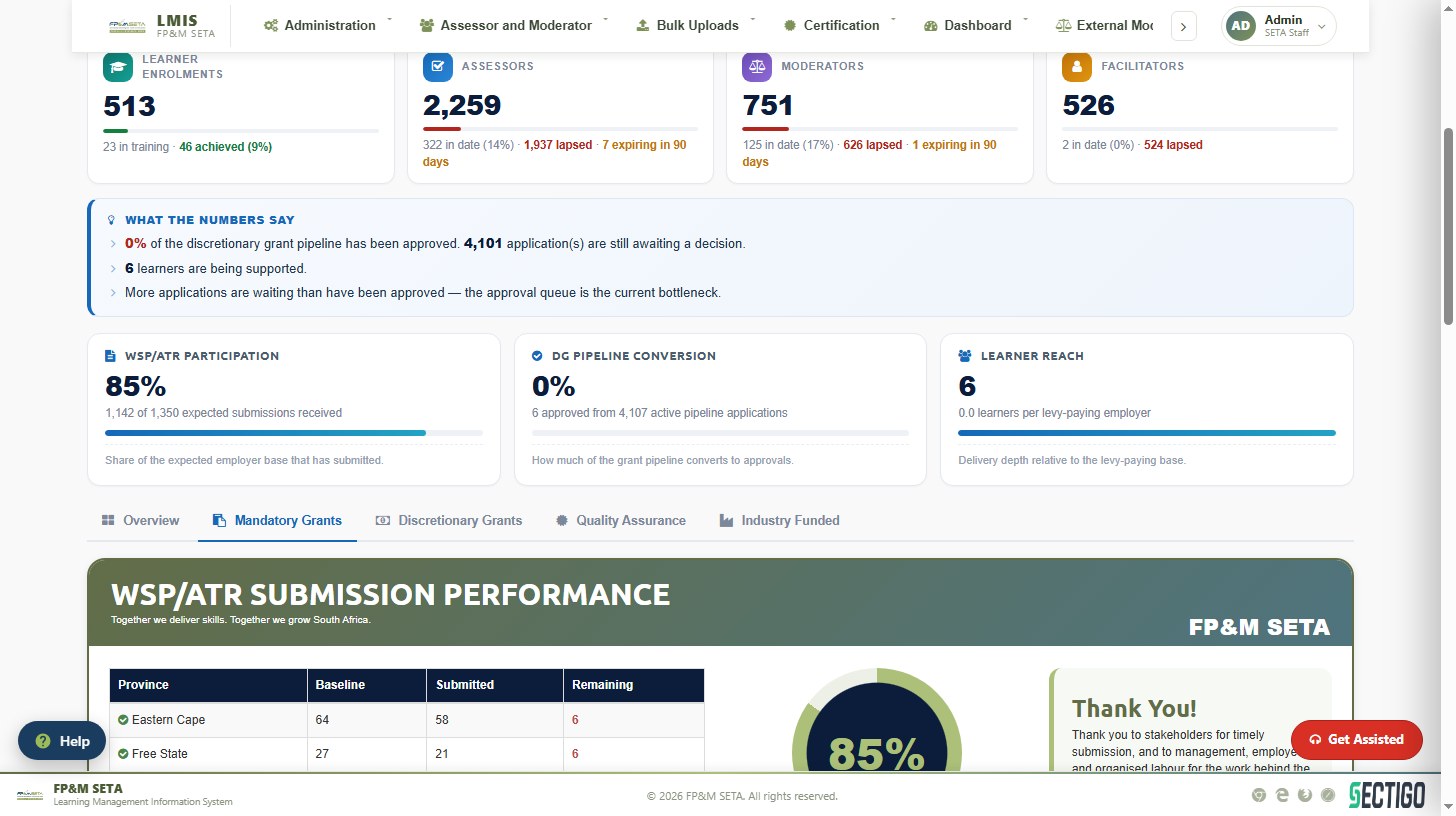
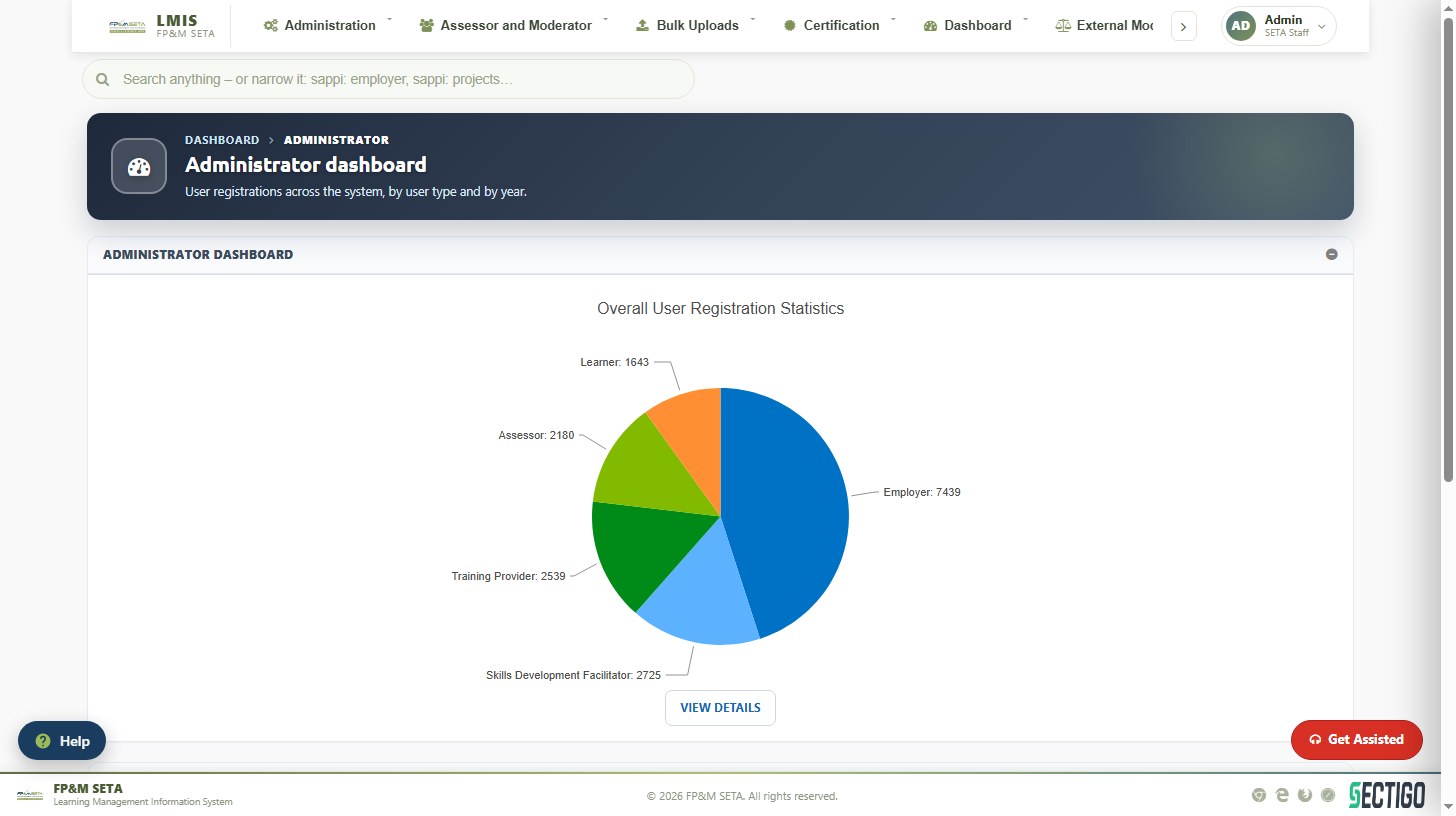
The Dashboard menu also holds focused dashboards: Administrator (user registration statistics), CEO Organisation Allocations and Performance, Discretionary Grants, Learner, Monitoring and Evaluation, Employer, Assessor, Moderator, Quality Assurance, Sector Skills Agent, Skills Development Provider and Sector Skills Planning. Charts can be collapsed with the – icon and most have a View Details button that opens the underlying list.
Was this article helpful?Thank you for your feedback.